
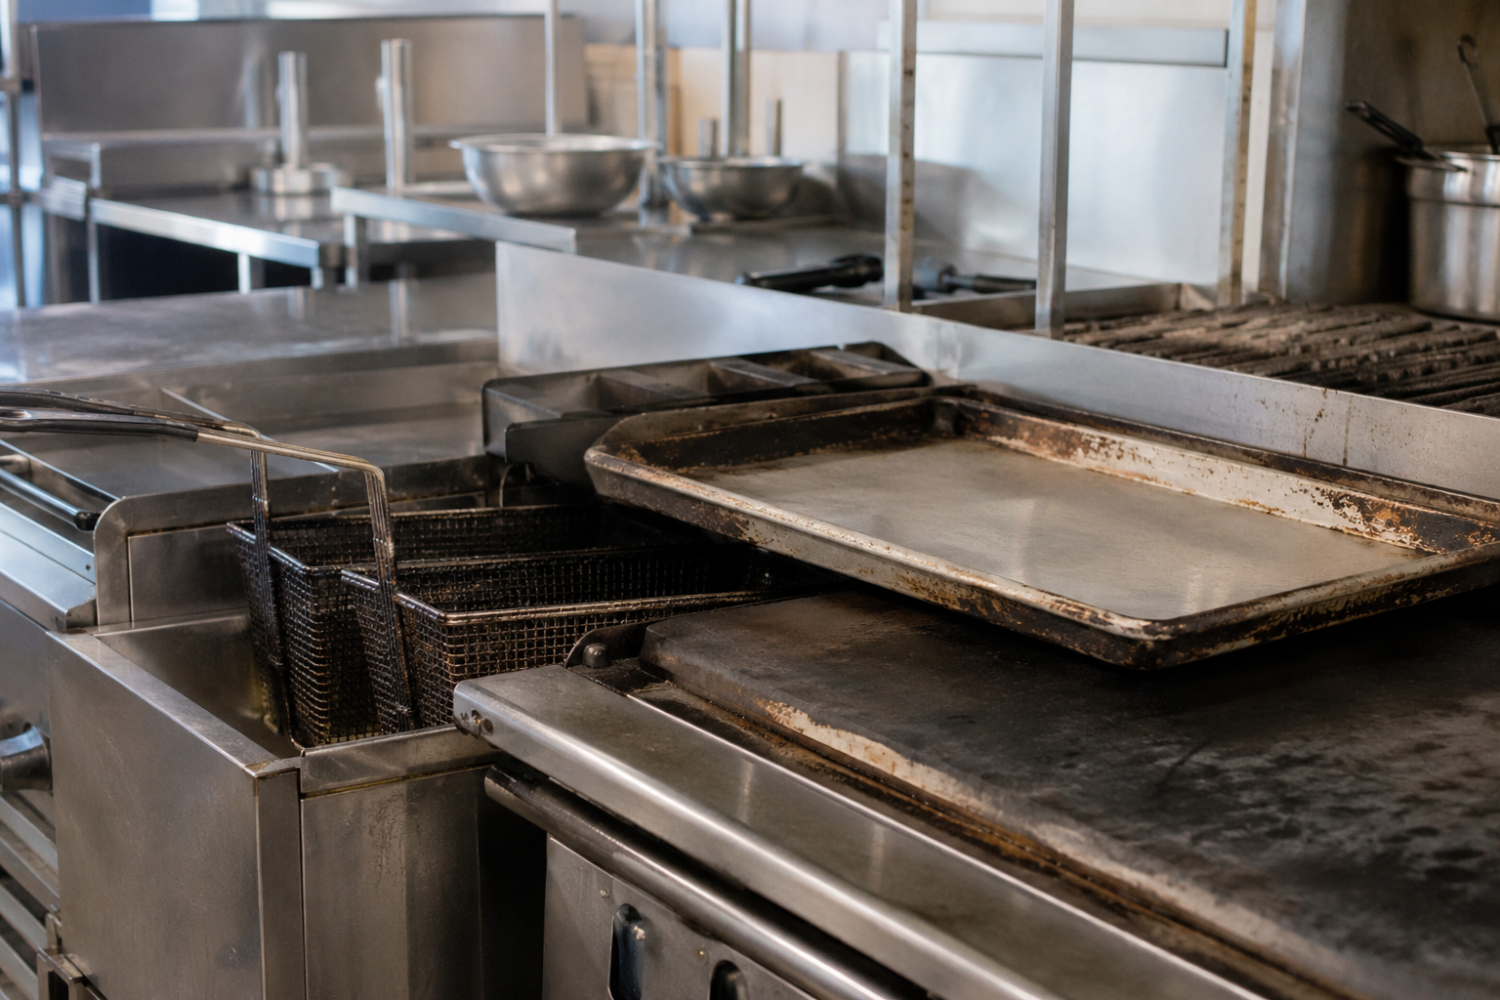
Carbon looks like a cleaning problem. In reality, it can be a labor, maintenance and operating-cost problem hiding in plain sight.
Most operators know what they spend on food, labor and rent. Far fewer can say what they spend dealing with carbon buildup on cookware and kitchen equipment.
Carbon buildup is easy to treat as a cosmetic issue: a blackened pan, a greasy grate, a hood filter that is harder to clean or a basket that never seems to look fully restored.
But when the process is examined across an entire restaurant, and especially across a multi-unit system, carbon can create costs in several different places at once.
That matters in 2026 because restaurant margins leave little room for invisible waste. The National Restaurant Association (NRA) estimates that average restaurant expenses have increased 36% since 2019 and notes that a typical restaurant historically operates on a pre-tax margin of roughly 5%. When margins are that narrow, even small recurring inefficiencies deserve attention.
The cost of carbon is not the buildup itself. It is everything your operation does because the buildup is there.
Cost #1: The Labor Spent Removing It
The most obvious cost is employee time. Carbonized grease and food residue can require repeated scrubbing, scraping, soaking and re-cleaning. Because these tasks are often scattered throughout the day, they rarely show up as a separate line item. They simply disappear into labor. To expose the cost, track active cleaning time rather than total soak time. If an employee spends 20 minutes scrubbing a set of items, leaves them to soak, then spends another 15 minutes finishing the job, the labor cost is 35 active minutes. Repeat that across days and locations, and the annual total can become significant.
Cost #2: Water and Cleaning Chemical
Manual carbon removal often uses more than one sink fill, multiple applications of detergent or degreaser, hot water and repeated rinsing. Operators may know what they spend on cleaning supplies in total, but not which processes drive that consumption. A better way to evaluate the process is to ask how much water and chemical are used per cleaning cycle and how often that cycle happens. Standardized soak processes can make usage easier to control because concentration, fill level and replacement frequency can be defined instead of left to individual habits.
Cost #3: Premature Replacement
There is also the cost of giving up on equipment that is still functional. A heavily carbonized pan, rack, grate or basket may be discarded not because it has failed, but because restoring it manually takes too long or the result never looks acceptable. That creates an avoidable purchasing cycle: buildup accumulates, cleaning becomes progressively harder, labor increases and eventually replacement feels easier than restoration. Operators should distinguish between equipment that is truly worn out and equipment that is simply difficult to clean with the current process.
Cost #4: Inconsistent Standards Between Locations and Shifts
Carbon removal is often one of those jobs where every kitchen has its own method. One employee uses more chemical, another scrubs longer, one manager schedules regular deep cleaning; another waits until the buildup is severe. That variation makes the real cost difficult to see and the outcome difficult to manage. For multi-unit brands, standardization can be as important as the cleaning method itself. A documented process of what goes into the system, how long it soaks, who checks it and when the solution is maintained gives operators a consistent baseline that can be trained and measured.
Cost #5: Opportunity Cost
Every minute spent manually fighting carbon is a minute that cannot be spent on something else. During a busy shift, that might mean prep, stocking, line support, dish flow or closing tasks. For a manager, it might mean training or quality checks. The opportunity cost is difficult to put on an invoice, but it is very real operationally.
Build Your Own “Cost of Carbon” Calculation
Operators do not need a complex financial model. Start with a one-week observation period and capture five inputs:
- Active employee minutes spent scrubbing, scraping or re-cleaning carbonized items.
- The fully loaded hourly labor cost for the employees doing the work.
- Approximate water and chemical used for the process.
- The number and cost of pans, baskets, grates, filters or other items replaced because they became too difficult to restore.
- The number of locations performing the same process.
Then annualize the result.
For example, if one location uses 30 active labor minutes per day on carbon removal and the illustrative fully loaded labor cost is $22 per hour, that is about $11 per day or roughly $4,000 per year in labor alone.
At 25 locations, the same routine represents about $100,000 in annual labor before water, chemical or replacement costs are considered.
The numbers are only an example, the important step is calculating the actual figure for your operation.
The Goal Is Not “Cleaner for the Sake of Cleaner”
Carbon-removal programs are most valuable when they are evaluated as an operating process rather than a cosmetic standard. The business case should be measured in employee time, consumables, equipment life, consistency and ease of execution. That perspective is increasingly relevant as restaurants search for efficiencies that do not compromise the guest experience.
The NRA’s 2026 outlook highlights improved productivity and technology-driven efficiency as priorities for the industry. Back-of-house cleaning may not be the most visible place to apply that thinking, but it is one of the easiest places to measure it.
Find Out What Carbon Buildup Is Costing You
Hyginix developed the FOG Tank as a heated soak system for removing carbon, grease and grime from commercial kitchen equipment.
If your team is still spending significant active labor scrubbing carbonized items, map the current process first, then compare the labor, water, chemical and replacement costs against a standardized soak process.